We Provide Cooling Tower Solution
Views: 0 Author: Site Editor Publish Time: 2025-12-15 Origin: Site


Whether you operate a large industrial water cooling tower or an HVAC water cooling tower system, regular performance evaluation is essential for reliability, efficiency, and longevity. This article explains how to check cooling tower performance, including key metrics, testing methods, calculators, and practical tips. Both water cooled tower and closed loop cooling tower systems are covered, with relevant tables and images to guide your inspection process. Examples reference best-practice solutions from manufacturers such as Mach Cooling (https://www.machcooling.com/).
A down-rated cooling tower wastes energy and water, increases operating costs, and may reduce the life of associated equipment. Performance checks help ensure:
Efficient heat rejection
Optimal cooling tower water supply usage
Reduced risk of microbiological growth and corrosion
Compliance with operational targets
Routine performance checks also support predictive maintenance and avoid catastrophic failures.
Performance is typically measured using range and approach:
Range = Hot water inlet temperature − Cold water outlet temperature
Approach = Cold water outlet temperature − Ambient wet bulb temperature
Low approach values indicate better performance.

Good performance ensures controlled water consumption. Important metrics include:
Evaporation loss rate
Blowdown rate
Total cooling tower water testing results
Air movement significantly impacts heat transfer:
Fan efficiency
Drift eliminators
Air flow uniformity
Poor airflow reduces thermal performance and wastes energy.
Measure temperatures at:
Hot water inlet (return from load)
Cold water outlet (to load)
Ambient location near tower inlet
Accurate instrumentation is key to reliable results.
Wet bulb temperature reflects actual cooling potential of ambient air. It should be taken close to the tower inlet, shielded from direct sunlight and moisture.
Water flow rate (m³/h or GPM) must be known for correct heat balance calculations. Use validated flow meters for accuracy.
Use the following formulas:
| Parameter | Formula |
|---|---|
| Range | (T_{hot} - T_{cold}) |
| Approach | (T_{cold} - T_{wet,bulb}) |
Example:
| Value | Measurement |
|---|---|
| Hot water inlet | 40°C |
| Cold water outlet | 30°C |
| Ambient wet bulb | 25°C |
Range = 40 − 30 = 10°C
Approach = 30 − 25 = 5°C
Smaller approach indicates better performance.
Confirm heat load matches design:
[
Q = 4.186 \times W \times (T_{hot} - T_{cold})
]
Where
(Q) = heat rejected (kW)
(W) = water flow (L/s)
Compare against design values from manufacturer data.
Cooling tower water testing should include:
pH
Conductivity
Hardness
Total dissolved solids (TDS)
Poor water quality lowers efficiency, accelerates corrosion, and increases fouling.
Check:
Fan RPM and power draw
Condition of blades
Drift eliminator integrity
Obstructions in air path or damaged fans can significantly reduce performance.
| Metric | Acceptable Range |
|---|---|
| Range | 5–12°C |
| Approach | <7°C for most systems |
| Cooling water return flow | Within 5% of design |
| Water conductivity | Per treatment standards |
Note: Targets vary by climate, system age, and installed capacity.
Closed loop cooling tower systems have separate spray and process circuits. Performance checks should ensure:
Spray water heat rejection matches design
Process loop temperatures are stable
Water quality in both circuits is acceptable
Accurate temperature measurements support reliable data.
Flow measurement enables correct heat balance calculations.
Portable kits can measure pH, conductivity, and hardness on site.
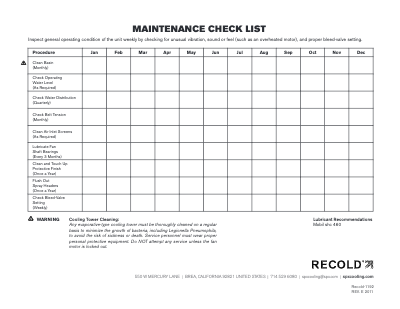
Basin water level
Fan operation
Water temperature readings
Visual signs of scale/fouling
Full cooling tower water testing
Blowdown rate versus target
Drift eliminator condition
Structural integrity
Mechanical and electrical reviews
Performance trend analysis
| Parameter | Value |
|---|---|
| Water flow | 1000 m³/h |
| Hot water inlet | 42°C |
| Cold water outlet | 32°C |
| Ambient wet bulb | 26°C |
Range = 42 – 32 = 10°C
Approach = 32 – 26 = 6°C
These values indicate reasonable performance but should be compared with design specifications from the cooling tower manufacturer.
Checking cooling tower performance is essential for maintaining the efficiency and reliability of any water cooling tower system. By focusing on thermal performance, water and air flow characteristics, and consistent cooling tower water testing, operators can identify issues early and optimize operations.
Regular performance checks support:
Lower operational costs
Improved water cooling tower water supply usage
Reduced environmental impact
Long service life for both water cooled tower and closed loop cooling tower systems
Utilizing comprehensive guides and products from industry leaders like Mach Cooling (https://www.machcooling.com/) makes performance evaluation structured and effective.
If you’d like, I can provide printable checklists, Excel calculators, or a PDF field guide for performance inspections!


